10.2 The Debugger 
First, we need a fairly simple code example to look at. Please type or copy the following into a Workspace.
| fileNames |
fileNames := OrderedCollection new.
(DirectoryEntry smalltalkImageDirectory)
    childrenDo: [ :f | fileNames add: f name ].
fileNames asArray.
Example 10.3: Names of Directory Entries
Now, you can Ctrl-a (select All) and Ctrl-p (select Print-it) to see the result.
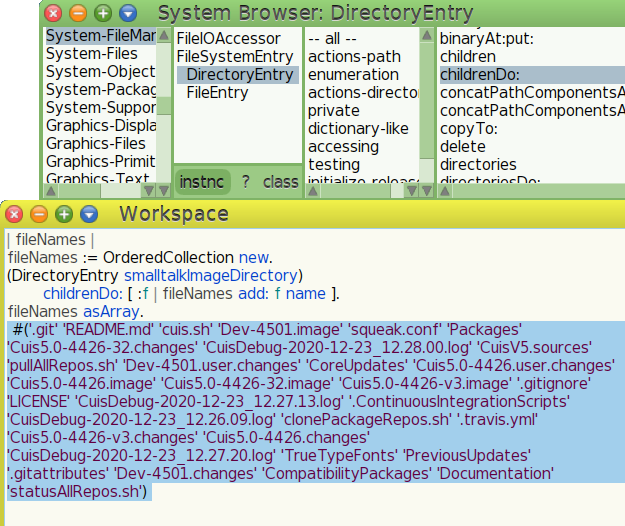
Figure 10.2: Names of files and directories in a Directory
The
CharacterSequenceclass has several method category names starting withfileman-for converting pathnames (system names for files and directories) intoFileEntryandDirectoryEntryobjects.CharacterSequence>>asFileEntrygives examples.
Now that we know what to expect, let us step through processing of the code using the debugger. Remove the result, then Ctrl-a (select All) and Ctrl-Shift-D (select Debug-it).
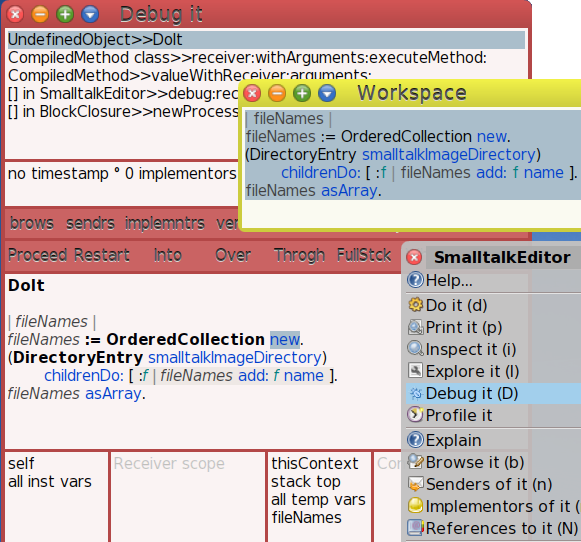
Figure 10.3: Debug It
The top pane in the debugger shows a view of the execution stack for this bit of execution context. The way to think of this, the model of execution, is that each time a method sends a message, it and its current state, arguments and local variables, are placed on a stack until the result of that message is received. If that message causes another message to be sent, then the new state is pushed onto the stack. When a result is returned, the stack frame is poped and processing continues. This works like a stack of trays in a cafeteria.
The stack frames are displayed to show the stacked receiver and method. The focus object, the receiver, for the selected stack frame has an inspector in the lower left debugger panes at the bottom or the window.
The next two lower panes are an inspector for the arguments and local variables, or temporaries, of the context frame.
The larger area displays the code being processed and hilights the next message to be sent.
The stack of (framed) execution contexts gives a history of the computation so far. You can select any frame, view instance values in the receiver, view the arguments and method variables at that point.
The two rows of buttons above the code pane give additional views and control of how the execution processing is to proceed.
Notable buttons in the second row:
- Proceed. Continue execution
- Restart. Start execution of the current method from
the beginning.
You can edit a method shown in the code pane, save it, and restart it! - Into. Step Into the code of the next message send.
- Over. Step Over the message send.
Do the next message send, but stay in the current method. - Through. Step into a block of code by going through –
skipping – the intermediate message sends.
Useful when you need to examine what is going on in a block of code, argument of the stepped message, for example the#do:message.
Now, we are going to play a bit. If you get out of synch with the instructions here, just close the debugger and start with Debug-It again.
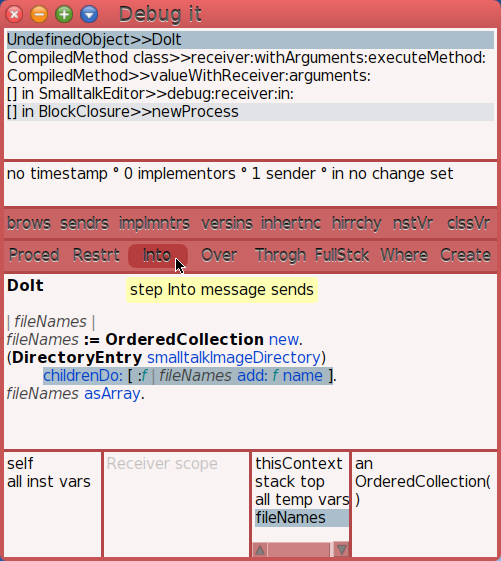
Figure 10.4: Step Into
As you single step the debugger, hilighting of the next message send changes. Press Over three times. You should see the line starting with childrenDo: hilighted. Now press Into.
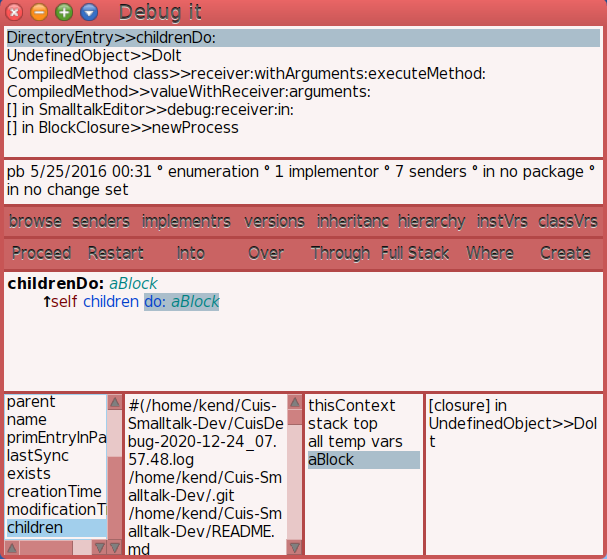
Figure 10.5: Viewing Focus Object and Temporaries
The stack area shows the focus object is a DirectoryEntry.
Inspect its instance values by selecting lines in the lower
left pane.
The stack area shows the focus method is DirectoryEntry>>childrenDo:.
This is the method displayed in the code pane.
The argument to childrenDo: is aBlock. There are no
method variables to display.
If you press Over again and Into, you should see the
context where do: is being processed.
This might be a good place to investigate the inspectors, look up and down the stack, and play around a bit. By this time you should feel confident that you understand the basics of what is displayed here.
You are in control!
Let’s look briefly at another way of doing this.